Hi, I'm Zainab Shaikh.
A
Self-driven, quick starter, passionate Data Analyst with a curious mind who enjoys solving a complex and challenging real-world problems.
About
I am a BSc in Information Technology graduate with a strong passion for turning data into meaningful insights. I enjoy problem-solving and working with data to drive informed decision-making. I always strive to bring 100% to the work I do. I have worked with technologies like Python, SQL, Tableau, Excel, Power BI, and machine learning libraries such as Pandas, NumPy, and Scikit-Learn. My academic and professional experiences have helped me strengthen my analytical skills, data visualization expertise, and ability to work with large datasets. I am passionate about using data-driven solutions to solve real-world problems and optimize business strategies.
- Languages: Python, SQL
- Databases: MySQL
- Libraries: NumPy, Pandas, Matplotlib, Seaborn
- Data Visualization: Tableau, Power BI
- Tools & Technologies: Git, Excel
Looking for an opportunity to work in a dynamic and analytical role that leverages my skills in data analysis, allowing for professional growth, hands-on experience, and continuous learning.
Experience
- Built an ML-based Disease Prediction System for Diabetes, Heart Disease, and Parkinson’s using patient data.
- Trained models (SVM, Logistic Regression, Random Forest, Decision Trees) for improved accuracy.
- Increased Heart Disease Prediction accuracy by 5.95% (84% → 89%) by implementing Logistic Regression.
- Enhanced Parkinson’s Prediction accuracy by 3.45% (87% → 90%) using Tomek Links for data balancing.
- Tools: Python, Numpy, Pandas, Scikit learn, Streamlit

- Cleaned and structured career preference data of Gen-Z for better analysis.
- Used Excel and SQL to uncover patterns in job preferences, salaries, and work environments.
- Created Power BI dashboards to visualize trends, aiding decision-making.
- Identified key correlations between salary expectations, career choices, and personal goals.
- Tools: Python, SQL, Excel, Power Bi,
Projects
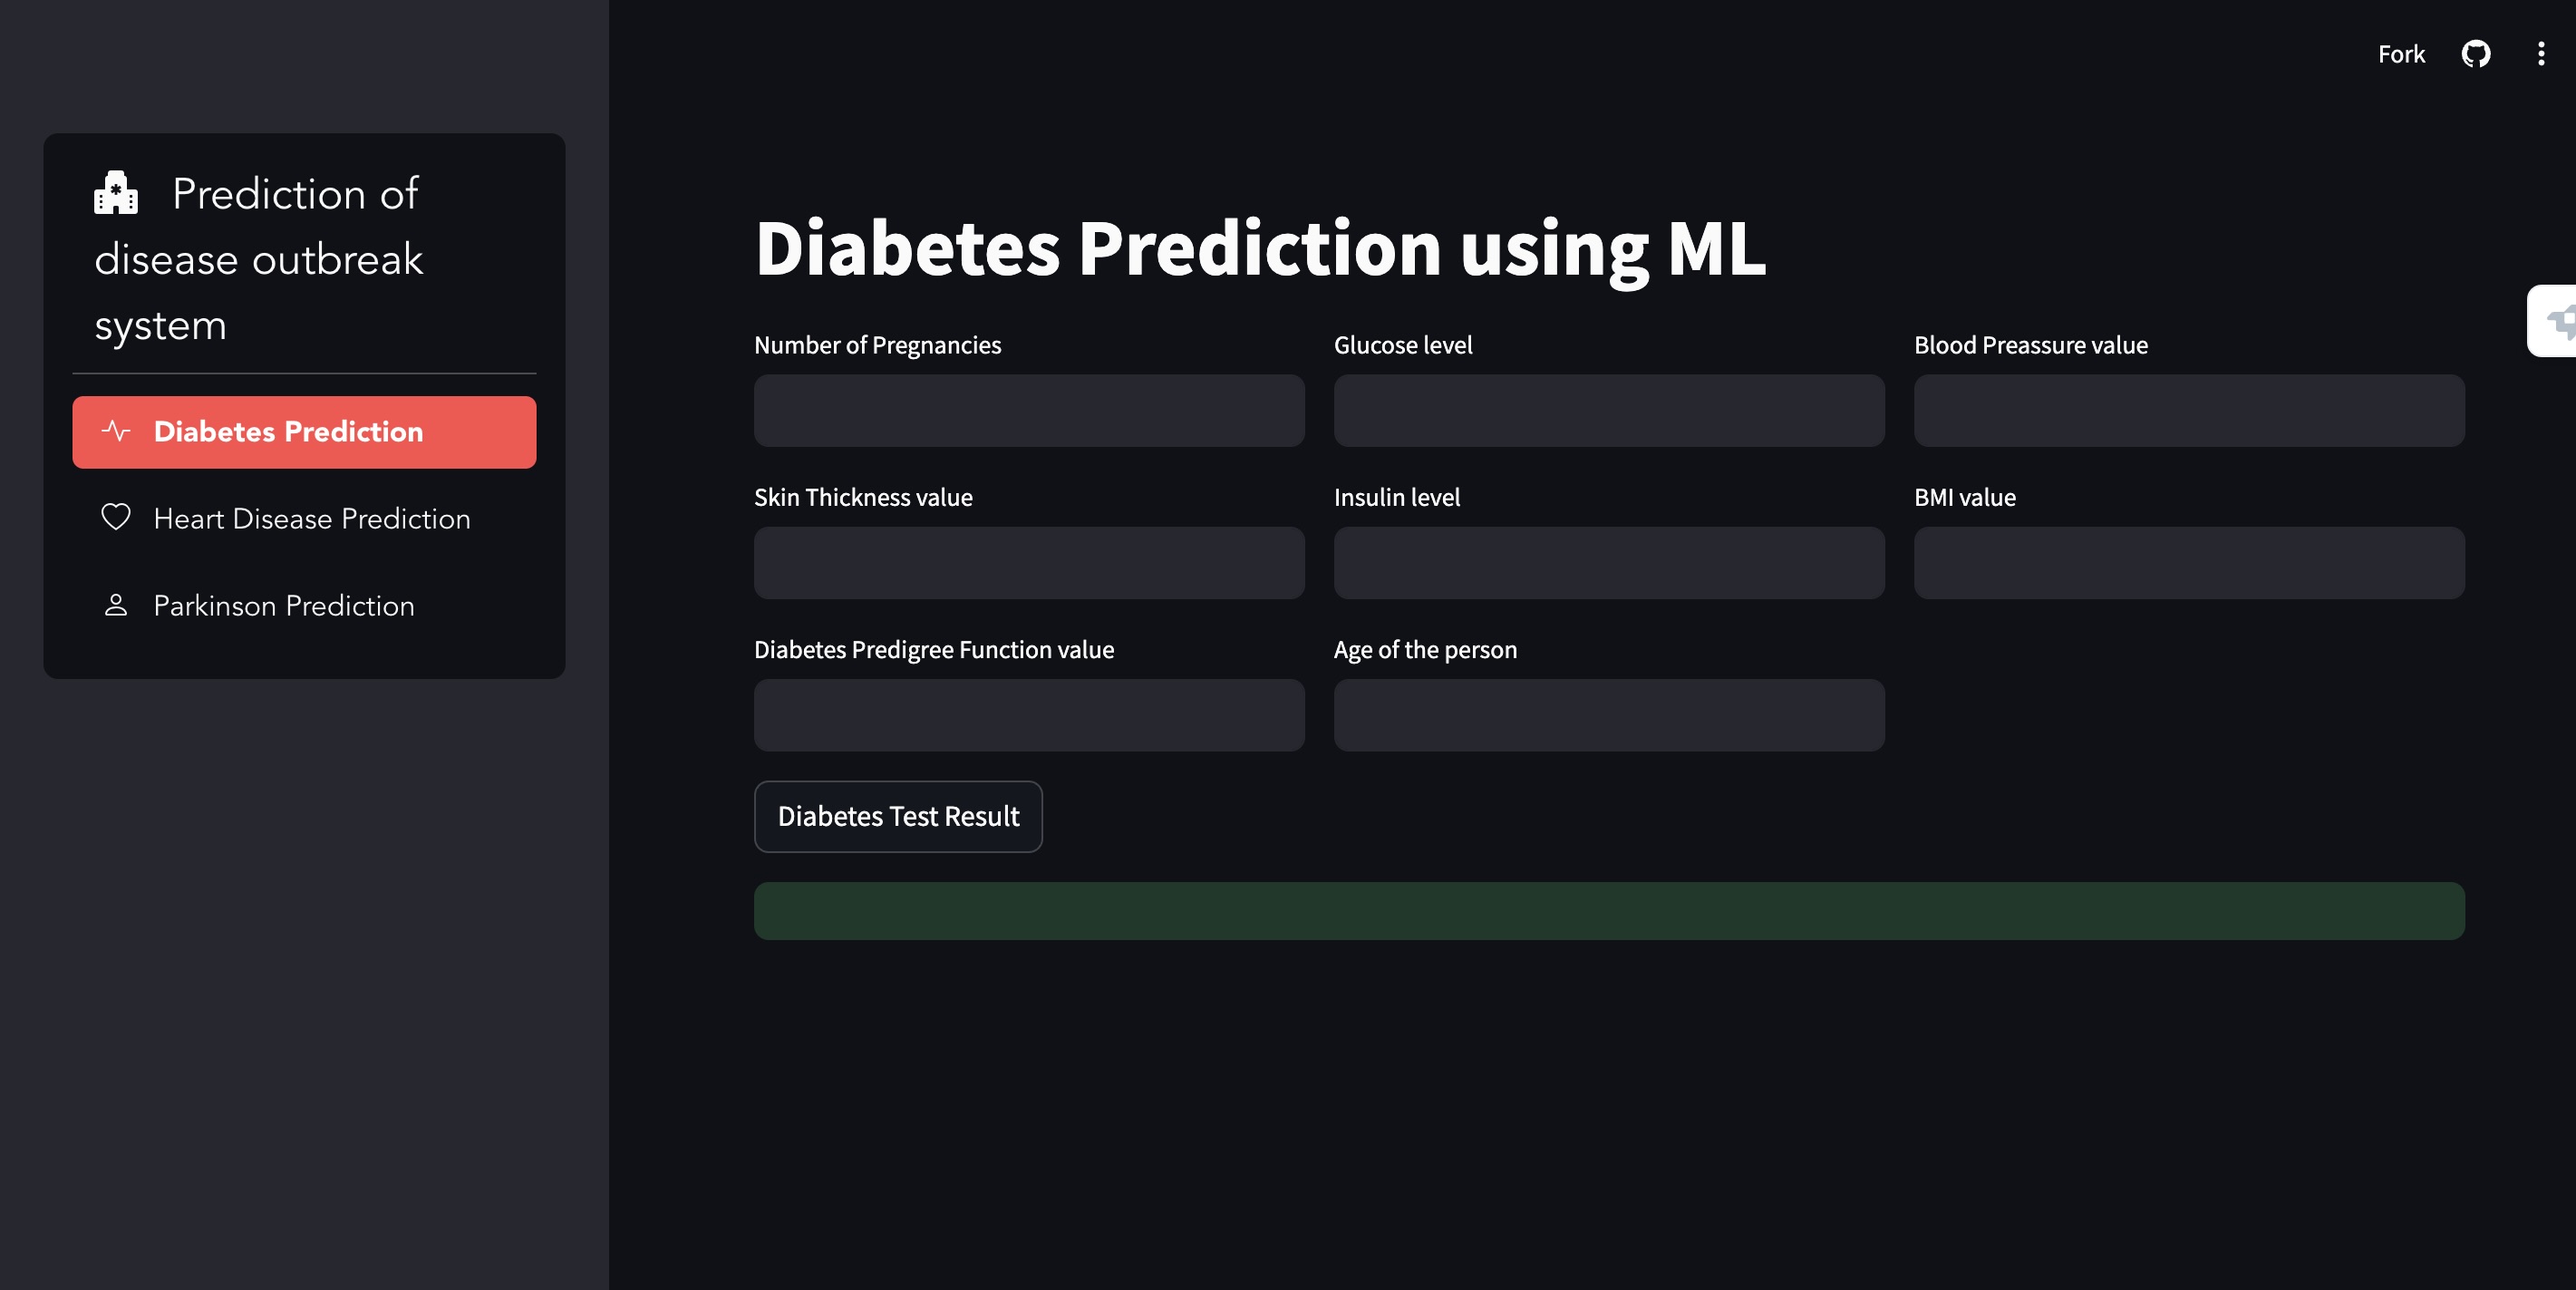
Developed an ML-based system for predicting Diabetes, Heart Disease, and Parkinson’s using patient data.
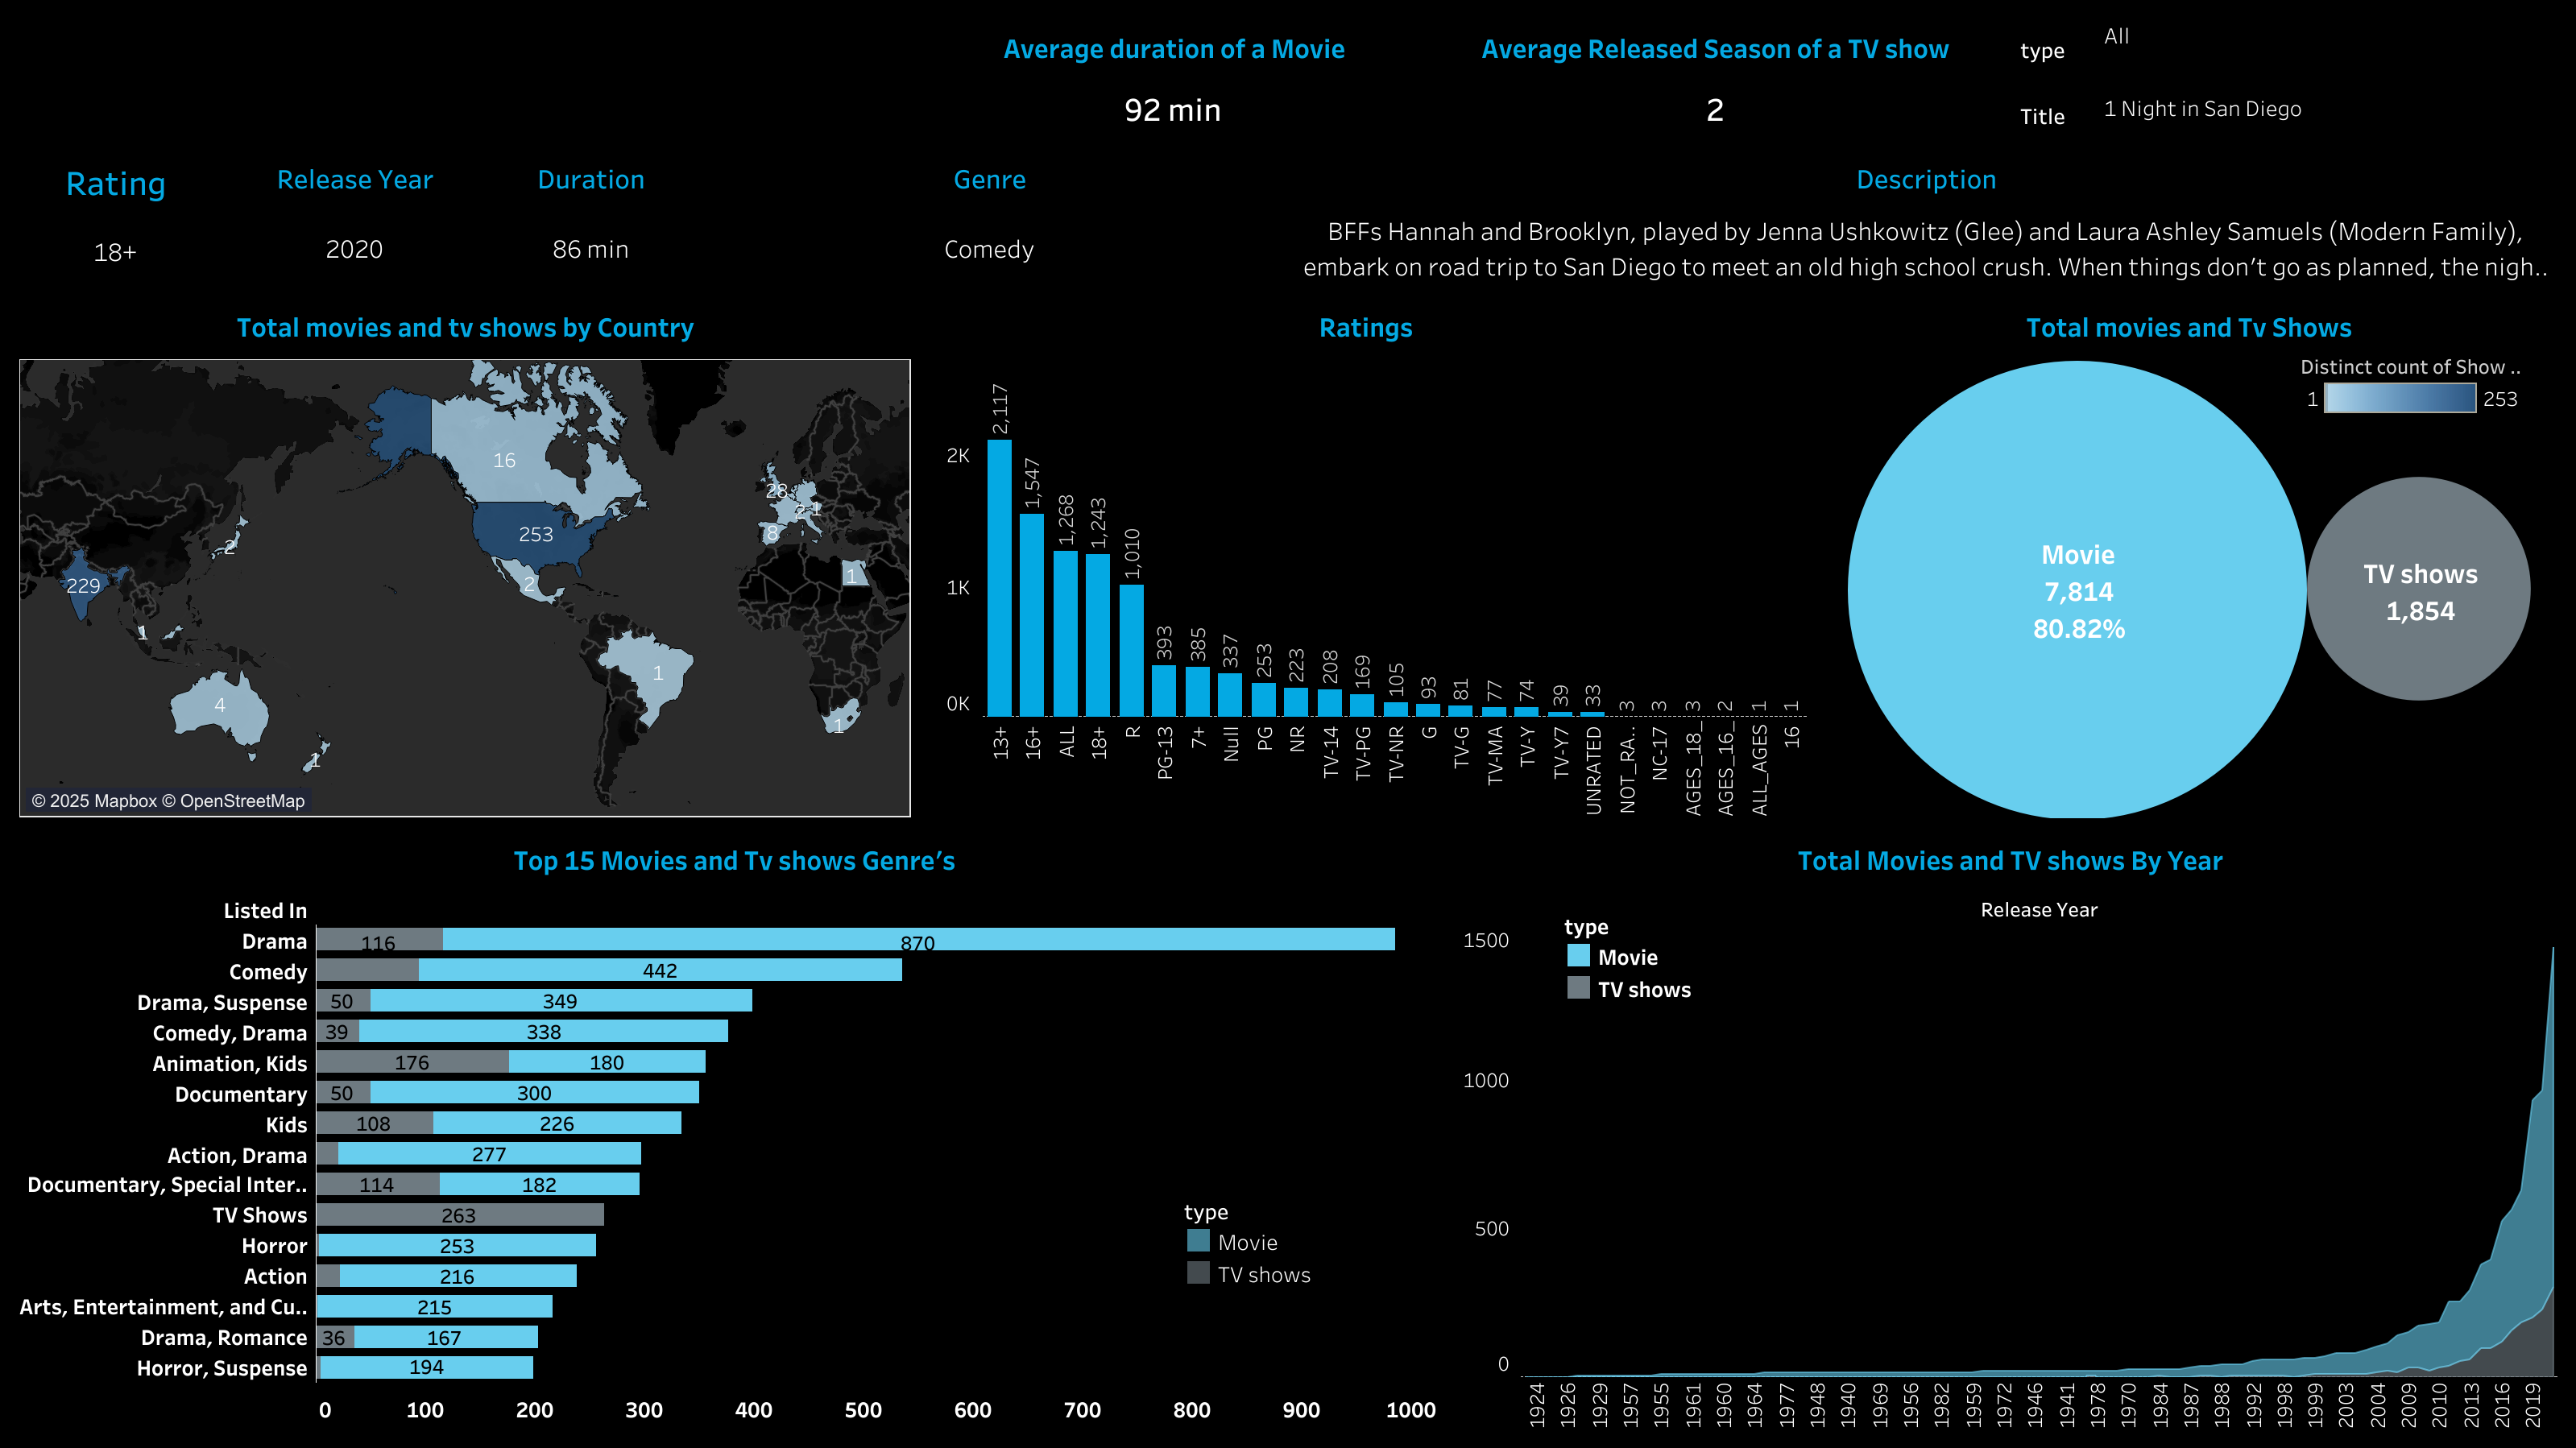
Interactive Tableau Dashboard Unveiling Trends in Amazon Prime Video Content & Ratings."
- Developed an interactive Tableau dashboard to analyze Amazon Prime Video's content library.
- Implemented data visualizations to track content distribution by year, country, and genre.
- Created calculated metrics and filters for dynamic exploration of movies and TV shows.
- Analyzed rating distributions and viewing trends to derive key streaming insights.
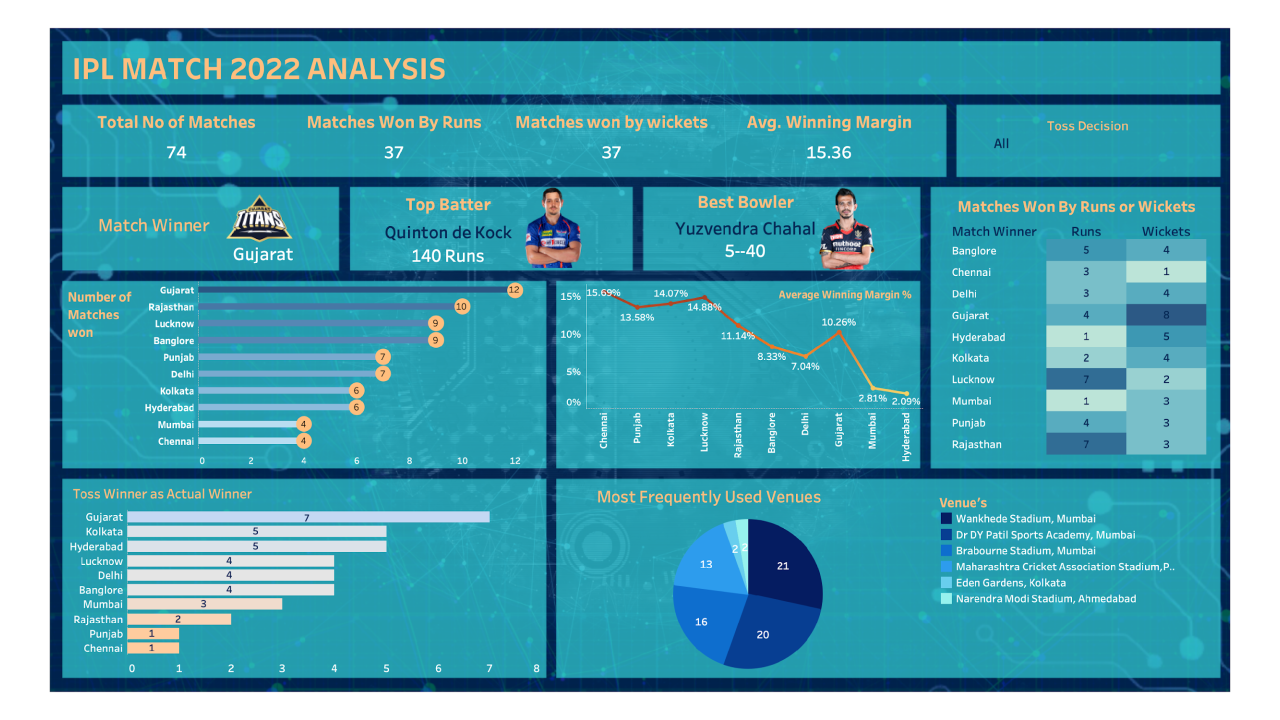
Analyzed IPL 2022 cricket matches using Tableau and AI-driven insights
- Designed an interactive Tableau dashboard to visualize IPL 2022 match insights.
- Used AI-driven analytics to identify winning patterns and performance trends.
- Created calculated fields and KPIs to analyze match outcomes and team stats.
- Developed data-driven comparisons for toss winners vs actual match winners.
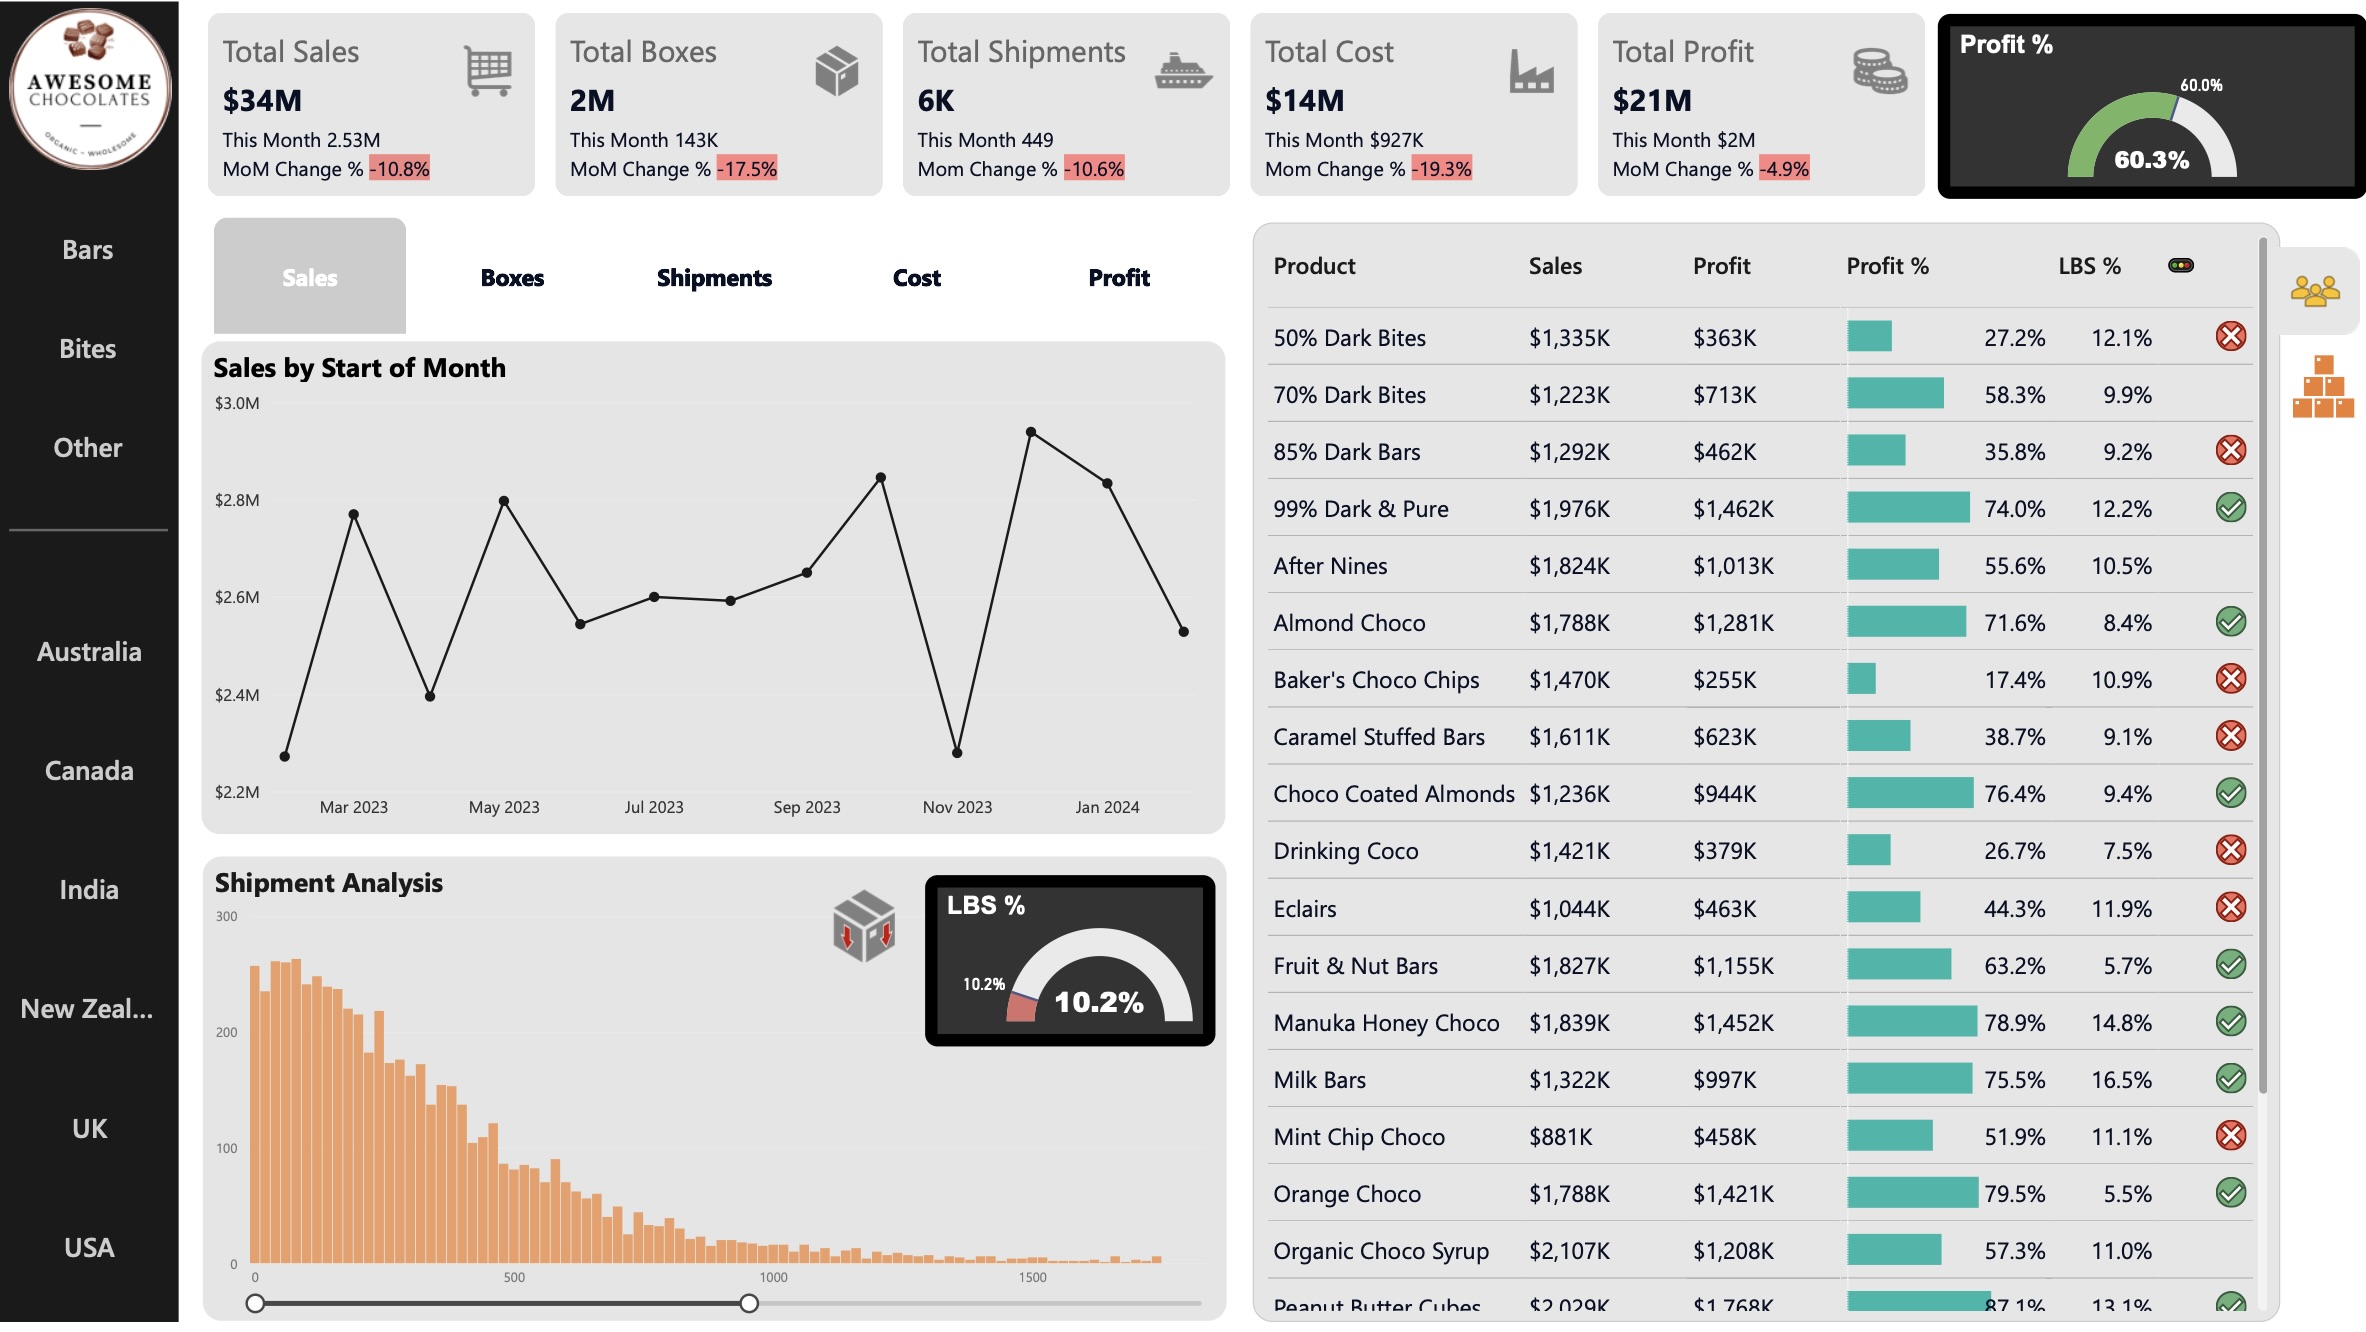
Power BI Sales Analysis Dashboard
- Tools: Power bI, DAX, Power Query, Time Intelligence Functions
- Dynamic visualizations for sales trends, shipment analysis, and product-wise performance.
- DAX calculations & measures for MoM change %, profit % and other key metrics..
- Time intelligence functions to analyze sales trends over different time periods.
- Interactive filters for region-wise and category-wise analysis..
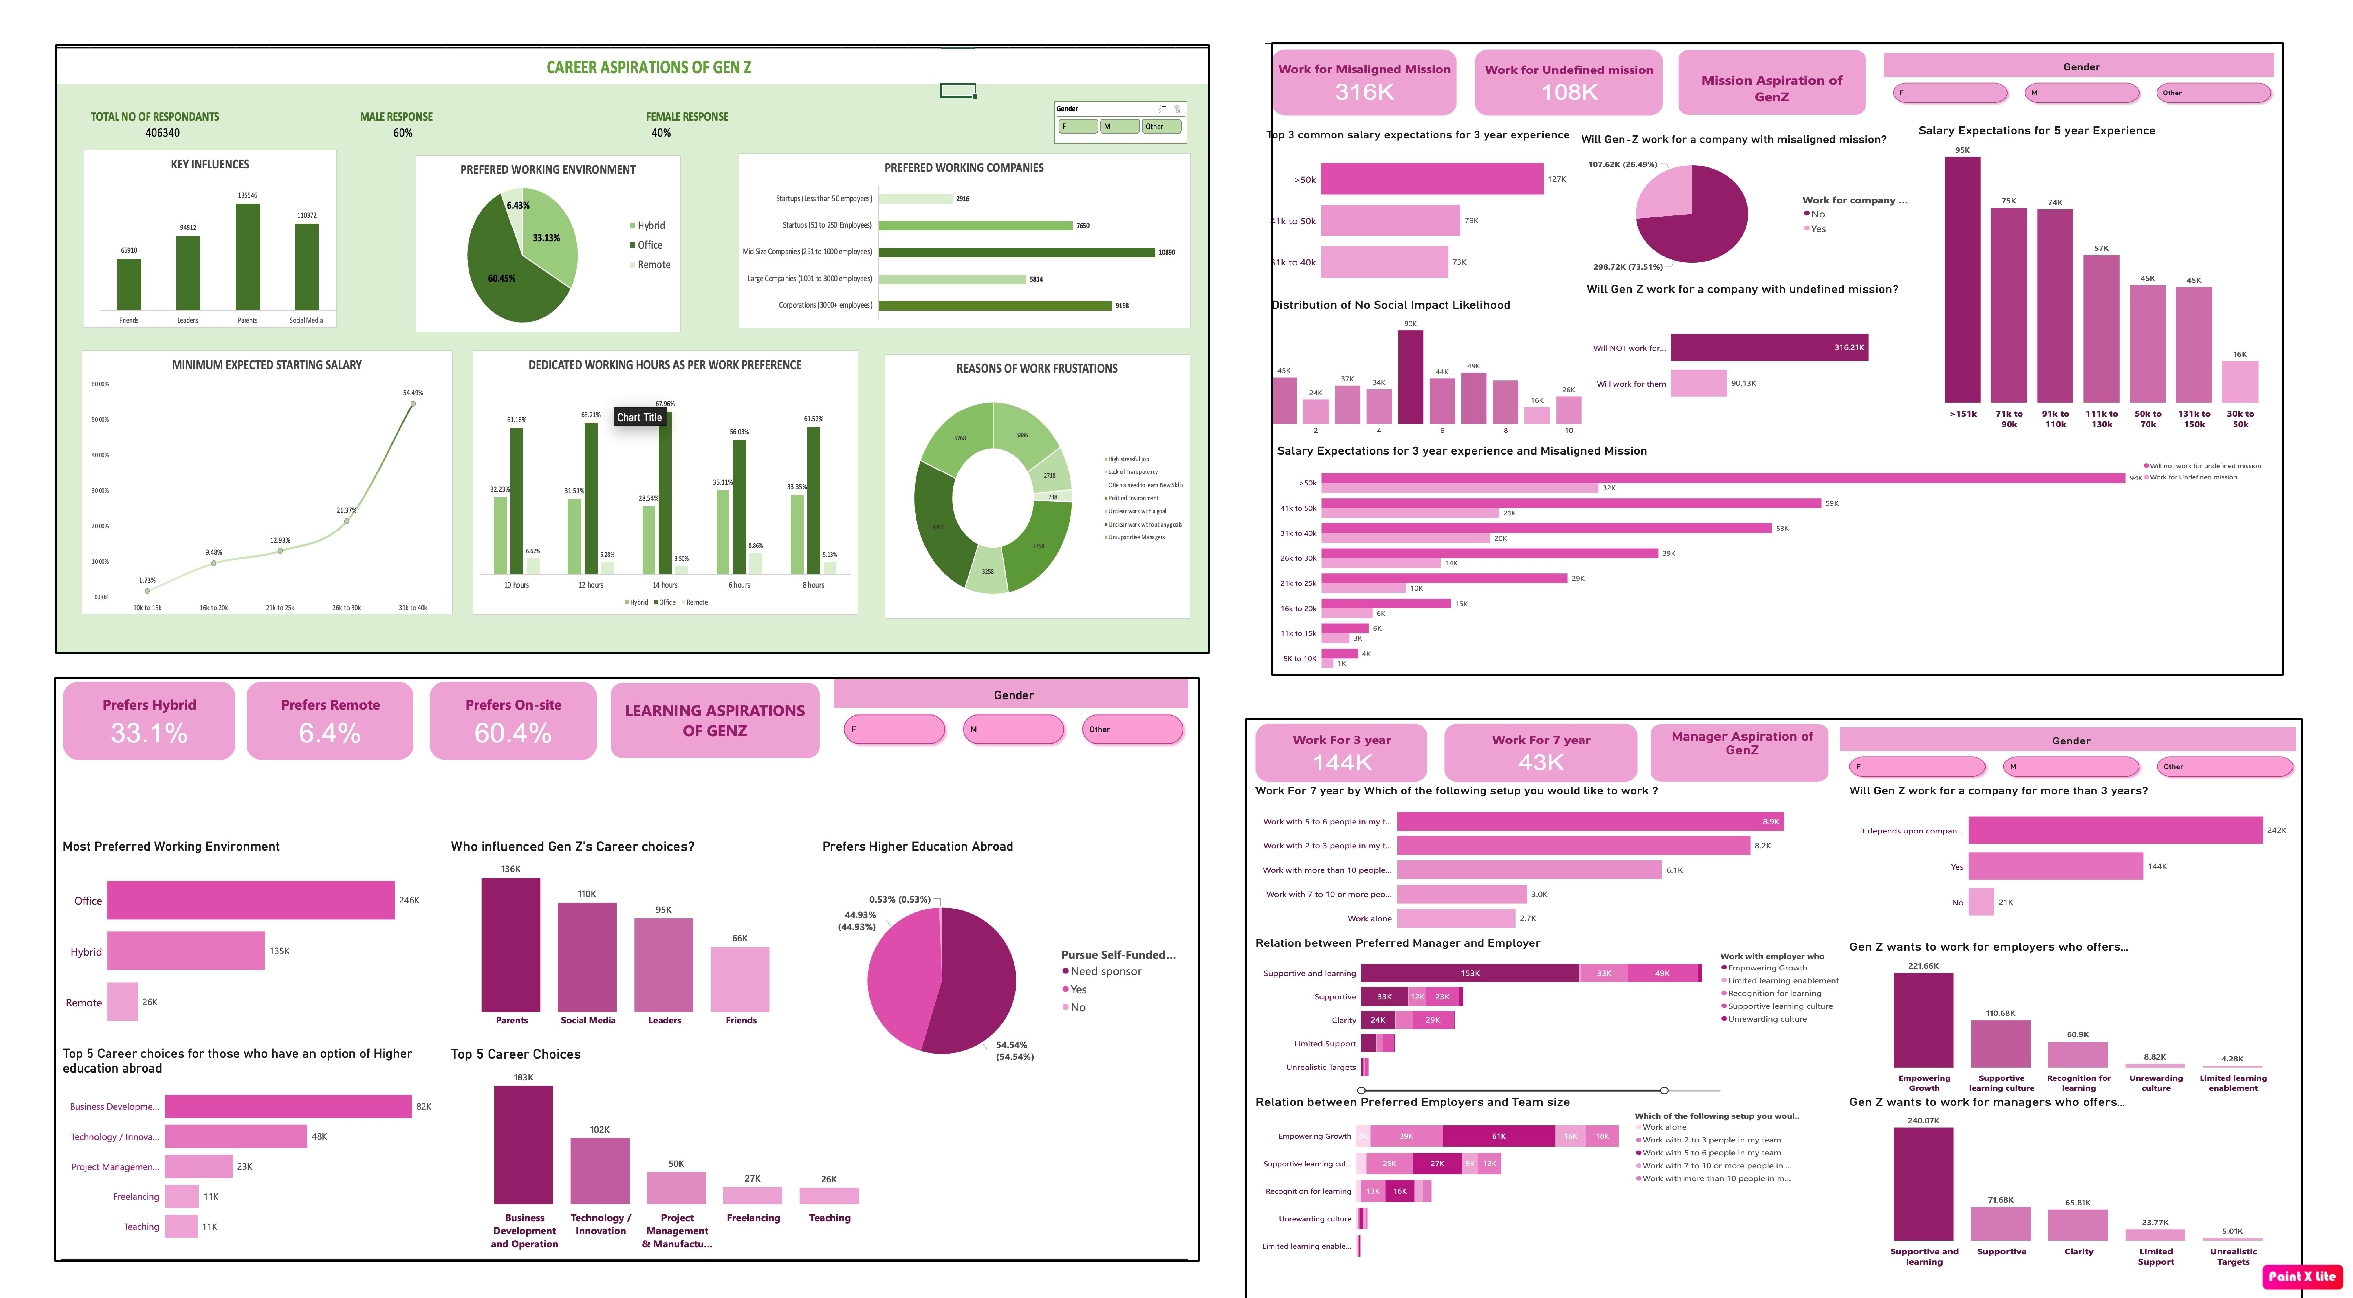
Analyzed Gen-Z career preferences and provided insights to refine hiring strategies.
- Processed and cleaned career aspirations data using Excel for accurate analysis.
- Created an Excel dashboard using pivot tables and charts to visualize key career trends and insights.
- Performed data queries using SQL to extract meaningful insights on career preferences and job trends.
- Built an interactive Power BI dashboard to present findings and enhance decision-making.
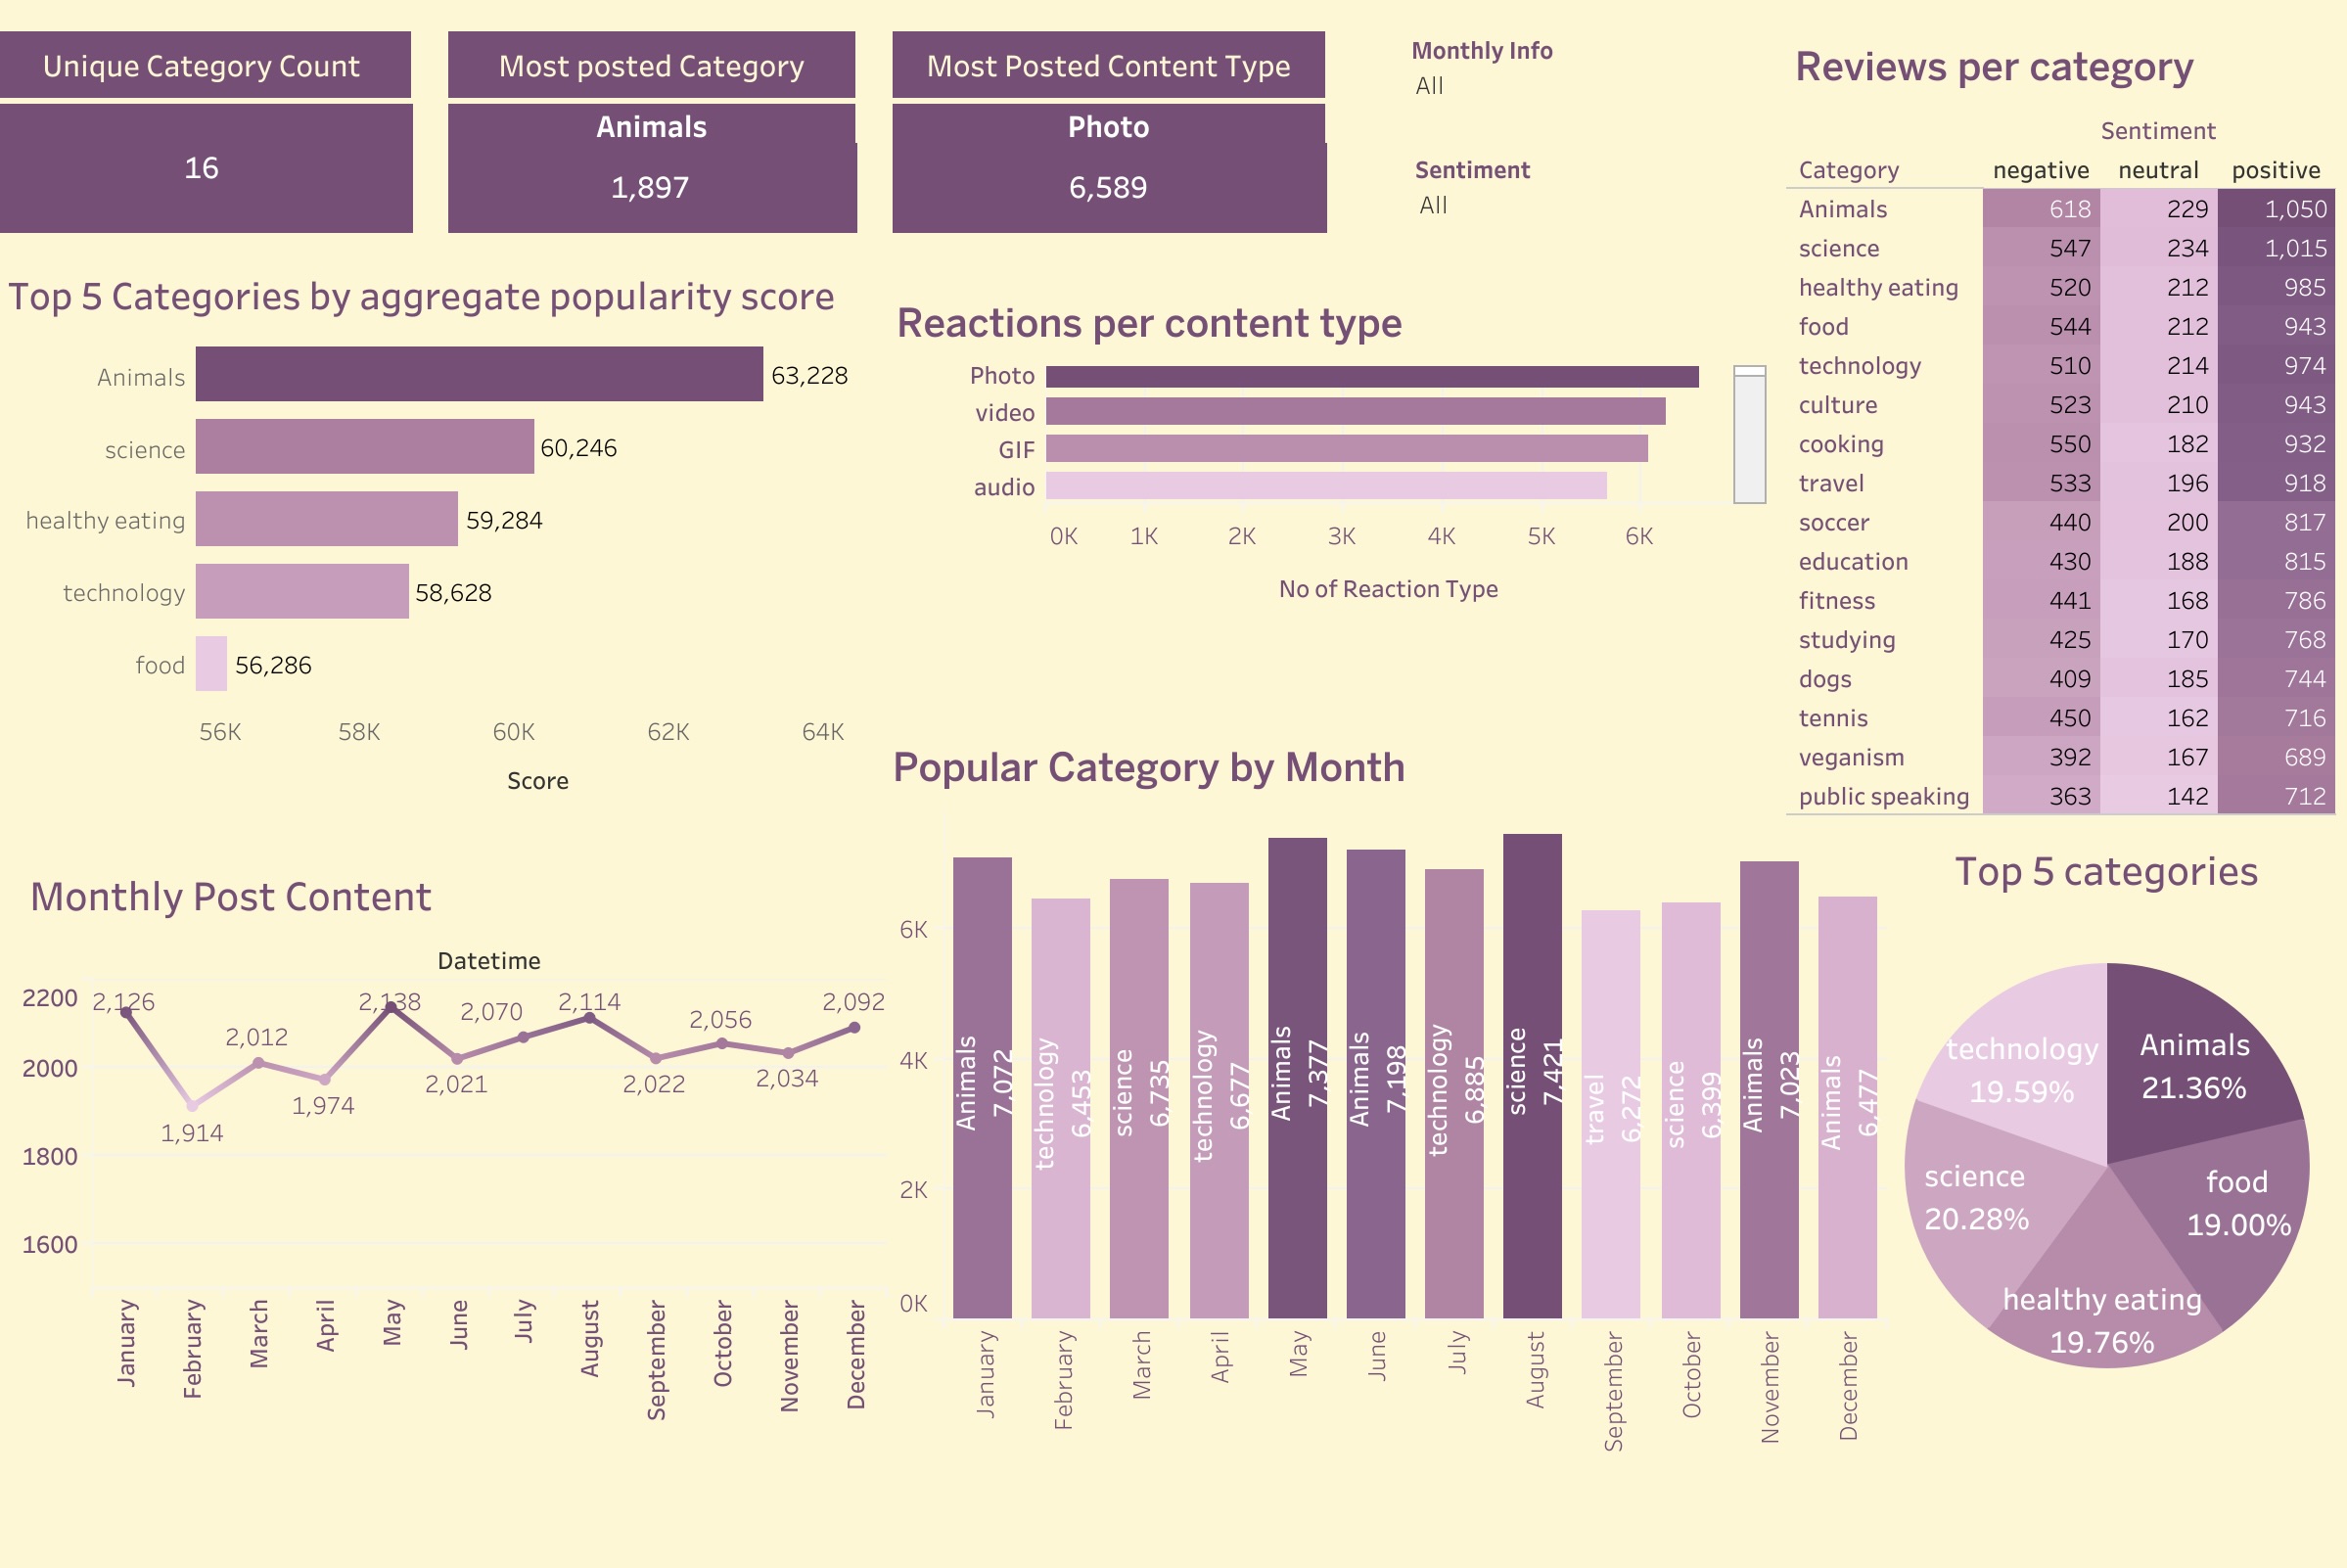
A Data-Driven Approach to Social Media Trends | Accenture Forage Simulation
- Data Cleaning in Excel by handling missing values, transforming data types, and removing irrelevant columns.
- Exploratory Data Analysis (EDA) to identify 16 unique categories and their engagement levels.
- Data Visualization in Tableau to analyze reactions per content type and monthly post trends.
- Trend Analysis to determine the most active posting months and top-performing categories.
Skills
Languages and Databases
 HTML5
HTML5
 CSS3
CSS3
Libraries
 Seaborn
Software and Platforms
Other
 Git
Git